What is the Circle of Suck?
I drew the “Circle of Suck” for NCAA college football conferences for 2019 as a joke on my boyfriend’s obsession with USC football. The Circle of Suck is complete when all the schools in a conference loses to another school (school A < school B < school C … < school A). I usually see people scramble to post these jokes on Twitter, Reddit, and Facebook.
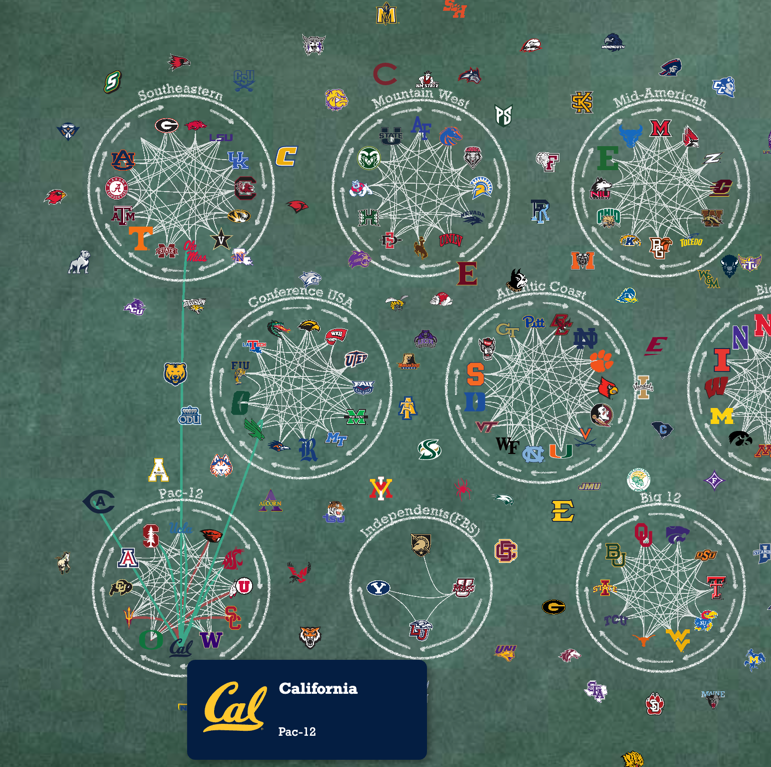
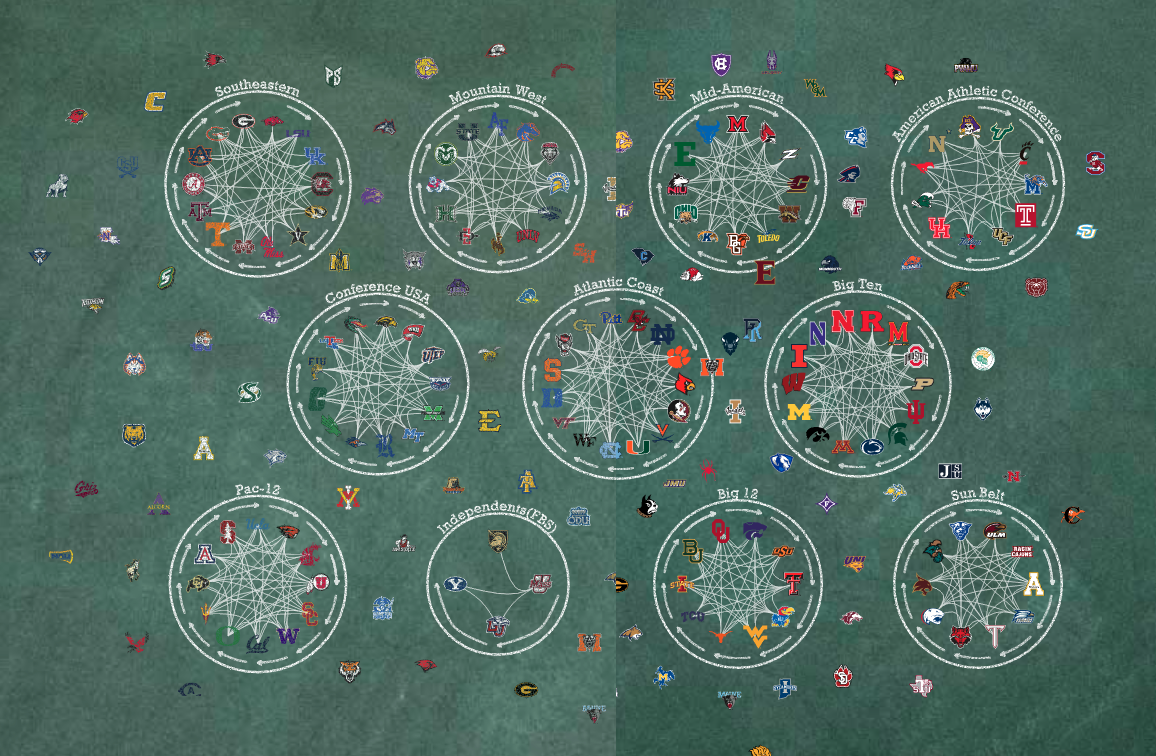
This visual has a green chalkboard background that alludes to both a grassy football field and a classroom. There are chalk-drawn circles indicating the 11 conferences with arrows showing which games form the Circle of Suck. You can easily find a team by searching for the conference first and then looking inside the circle if the team belongs to the conference or looking near the circle if the team mostly plays against other teams in a particular conference. When you hover over a school, all their games will show up as green (wins) or red (losses) links connecting to the opposing school.
Web-Scraping with BeautifulSoup
I used BeautifulSoup to web-scrape the NCAA football website, which has a home page for all the matches by week and a deep-dive for each game. BeautifulSoup helped me get school colors and logo for each team, but both came in different challenges.
Getting colors from the CSS style section
Each team’s primary and secondary colors were found in the div.gamecenter-game-banner section in the HTML for each game. Usually, BeautifulSoup is easy for getting the inner HTML or the value, but the colors were part of the CSS, in the <style> element, which required a workaround. I imported another library called cssutils to help me parse CSS. My code below shows how I parsed the CSS to get the correct class and fill attribute in a Python dict structure.
# Parse css for colors
selectors = {}
for styletag in soup.select("style"):
    css = cssutils.parseString(styletag.encode_contents())
    for rule in css:
        if rule.type == rule.STYLE_RULE:
            style = rule.selectorText
            selectors[style] = {}
            for item in rule.style:
                propertyname = item.name
                value = item.value
                selectors[style][propertyname] = value

print(selectors.get(".homeTeam-fill-primary_color").get("fill", "#fff")) # Returns #003087
print(selectors.get(".homeTeam-fill-secondary_color").get("fill", "#fff")) # Returns #00266c
print(selectors.get(".awayTeam-fill-primary_color").get("fill", "#fff")) # Returns #154734
print(selectors.get(".awayTeam-fill-secondary_color").get("fill", "#fff")) # Returns #103829
Downloading images programatically
I used Python’s os library to create a subdirectory and store my downloaded SVG images, for which I found the filepath using BeautifulSoup. However, it was only saving empty and broken files because BeautifulSoup reads static text and wasn’t actually accessing the image file from the network. The remedy was to use urlretrieve from the urllib.request library which takes care of using network connections to open URLs.
My code below shows how I programatically downloaded SVG files using urllib.request. I also had to download for the home and away classes and convert them into a “winner” and “loser” for my analysis.
for side in sides:
    team = sides.get(side)
    if not os.path.exists(f"{folder_name}/{team}.svg"):
        image_link = (
            f"https:{banner.find('div', attrs={'class': side}).img['src']}"
        )
        urlretrieve(image_link, f"{folder_name}/{team}.svg")
Other nuances with web-scraping
In addition to finding games, I also had to scrape the Standings Page to know the conferences, which apparently wasn’t listed elsewhere.
After obtaining the team and game information and images, I also had to do some manual cleanup with names because some names were inconsistent across pages (e.g. “St.” and “State”; “FLA”, “FL”, and “Florida”).
Finding the Circle of Suck with NetworkX
To find the Circle of Suck or get the longest chain if it didn’t exist, I created a directed graph with Networkx to compute the longest cycle in a given conference. Networkx has a convenient method called simple_cycles that returns an elementary circuit, or a closed path with no repeats. I sorted all the computed cycles by their lengths in decreasing order. If the first cycle’s length is equal to the number of teams in a conference, we will know that the Circle of Suck is complete. Otherwise, we would have the longest chain of losses prior to the Circle of Suck’s completion.
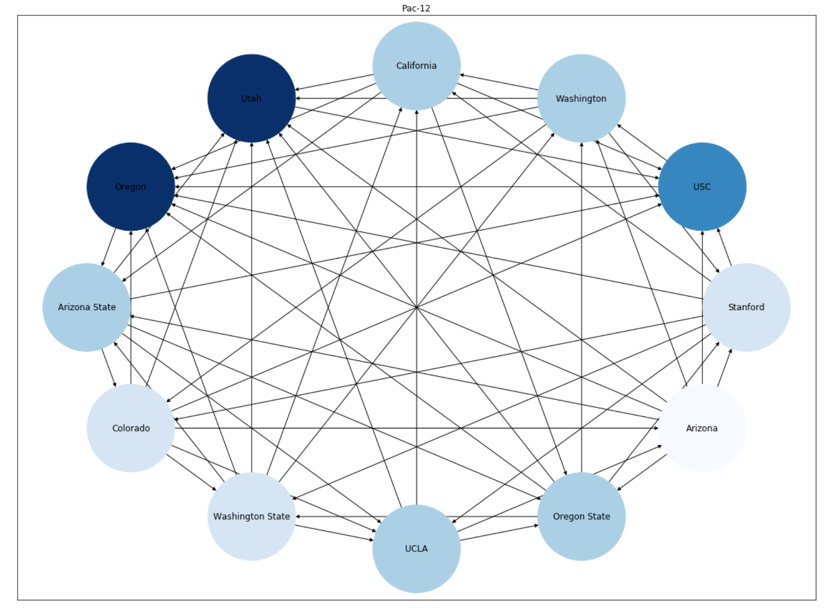
I also used the draw_networkx method to visualize what each conference would look like in a circular_layout. However, I can’t order the nodes in a particular order, which is why they’re not arranged in the “correct” order. That will change with D3 because I assigned each team an index within their conference which determines their placement.
Visualizing with D3
Using imported SVG
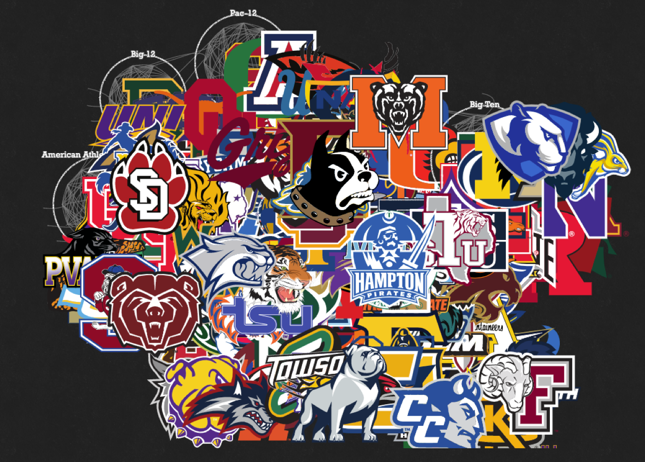
As with almost all my projects, I scrapped my initial design because I underestimated the volume and complexity of my data. Showing everything and too many things at once does not look good. This kind of looks like my hairbrush lol.
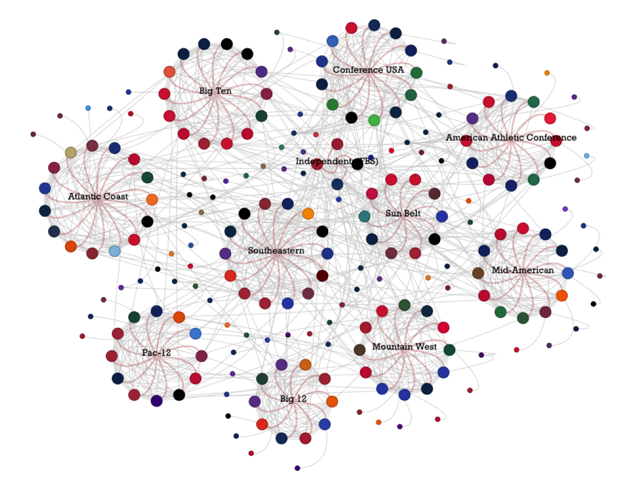
I changed my background to a black chalkboard and then a green chalkboard to invert the link colors, which I think look better and thematic as white chalk, which I created with a filter. I also replaced the circles from the first visual with team logos, but you can see my mistake here due to lack of resizing.
In order to resize my image that I inserted using D3, I used this code block based on a StackOverflow post. I thought this was pretty difficult in terms of reverse engineering and validating because this is different from the usual way of appending shapes using D3.
selection
	.append("image")
	    .attr("x", d => d.x)
	    .attr("y", d => d.y
	    .attr("height", height)
	    .attr("viewBox", `0 0 ${width} ${height}`)                   // use this is resize the SVG
	    .attr("xlink:href", d => `img/tooltip/${d.image_name}.svg`)  // this is like "src" in the img element
While I was able to insert all my SVGs, I still thought they looked too “solid” and “perfect” against the chalk-drawn background. So then I wondered if it was possible to alter the inline SVGs after injecting them. This required me to approach this problem differently because I needed to read the code in the SVG files rather than pointing to their addresses.
My research yielded 2 ways to read the SVG’s text:
- Use
d3.xml(see example) - Use
fetch(see example)
Both examples I found didn’t fit my use case exactly, so I had to experiment. I chose fetch because I knew I could ask some JS literate friends about fetch. When I first used the asynchronous fetch, I was so confused on why my logs were showing “pending” Promises instead of the actual SVG text. This meant that I was logging before the script finished retreiving and reading the file, which meant that it wasn’t usable if I were to pass it to a callback function. After more research, I learned that I could use the Promise object to make sure fetch would complete before running the next step.
This code below shows my 3-step process using .then() (although async/await is a cleaner way of writing that I have yet to explore):
- Make sure all
fetchmethods (stored in an Array calledfetches) are complete. - Make sure to get the “text” attribute from every response (apparently that needs a promise too, since it’s still a result of
fetch). - Use the text
datain a callback.
Promise.all(fetches)
    .then((responses) => {
        return Promise.all(responses.map(res => res.text()))
    })
    .then((data) => {

        // Post message back
        postMessage({
            nodes: event.data.nodes,
            links: event.data.links,
            images: data,
        });
    });
I can then add the SVG’s text as a DOM element’s innerHTML, select it using D3, and manipulate it. Since I was adding 1 SVG per team, I applied the chalk filter to the <g> element containing all the teams, which applied the filter to all my images.
// Add SVG's text as innerHTML
document.getElementById("node").innerHTML = data;

// Alter the SVG
d3.select("node")
    .attr("height", 30) // Change the height of SVG using D3
Here’s a comparison where the teams on the left are altered with the chalk filter and teams on the right are just imported and resized images. My favorite difference is Florida Gators because the green blends in with the background.
Running Simulation on Web Workers
I played a lot with node placement, but the conferences were clumped too awkwardly, leaving big gaps of tiny non-conference teams in the center. After a long week of experimentation of customizing forces, I ended up creating fixed values by setting fx and fy attributes for the conferences in order to make both conferences and teams distribute evenly. This looked the best, and it was an opportunity for me to read the d3.js source code to understand how forces really worked.
Another problem I faced was performance because I was making a lot of images move on each tick. In my first attempt, I did not add the images until the simulation determined every team’s final placement. However, I read online that people were using Web Workers to boost D3 performance, especially for static charts. Mike Bostock already provided an easy-to-follow template that helped me get started.
This was the only additional skeleton I added to my main script.
// Create a worker which references your worker JS script
var worker = new Worker("worker.js");

// Post data to your worker
worker.postMessage({
  nodes: nodes,
  links: links
});

// Get data that the worker sends back and run the rest of script with that data
worker.onmessage = function(event) {
  runRestOfScript(event)
};
In my worker.js script, I wrote my instructions in a function called onmessage. The worker receives data through the event parameter and runs heavy calculations that do not require interacting with the DOM. It would send back data to my main.js script using postMessage().
importScripts("https://d3js.org/d3.v6.min.js");

onmessage = (event) => {

    // Calculate Simulation which alters event.data.nodes and event.data.links

    // Post message back
    postMessage({
        nodes: event.data.nodes,
        links: event.data.links,
    });
}
Web Workers are really magical. They cut my rendering from approximately 6 seconds to 2 seconds. I would recommend them if you’re trying to create a static chart that requires a simulation to determine every object’s placement.
Hovering with Tooltip
I used a nested <div> structure for my tooltip and SVG.
<div id="chart">
	<svg>...</svg>
	<div id="tooltip">
		...
	</div>
</div>
Usually when I hover over an object, I would place the tooltip object near my mouse by using the object’s x and y coordinates as a proxy. I thiiiiiink I had trouble implementing it because I was hovering over an image, so if I were to use d3.select(this) as I normally would, I would get null.
I looked up how to get my mouse’s coordinates instead of relying on the object, and those solutions exist! I used the mouse event’s pageX and pageY coordinates. Note that it’s passed as the first argument, while the data is passed as the second with D3’s .on.
.on("mouseover", (e, d) => {

    // Update position
    let xPosition = e.pageX + tooltipPadding,
        yPosition = e.pageY + tooltipPadding;

    // Do your thing
}
Now we have a working tooltip with colored links indicating wins and losses!