Data Collection
I used the business search endpoint from Yelp’s API to collect data on any type of business in Culver City, CA, which is where I was working at the time. I saved my data in .csv form because I was most familiar with this format based on my experience using python pandas. In my opinion, saving as a JSON allows for more flexibility in D3 but is not always necessary. I just didn’t know much about the differences when I first started out.
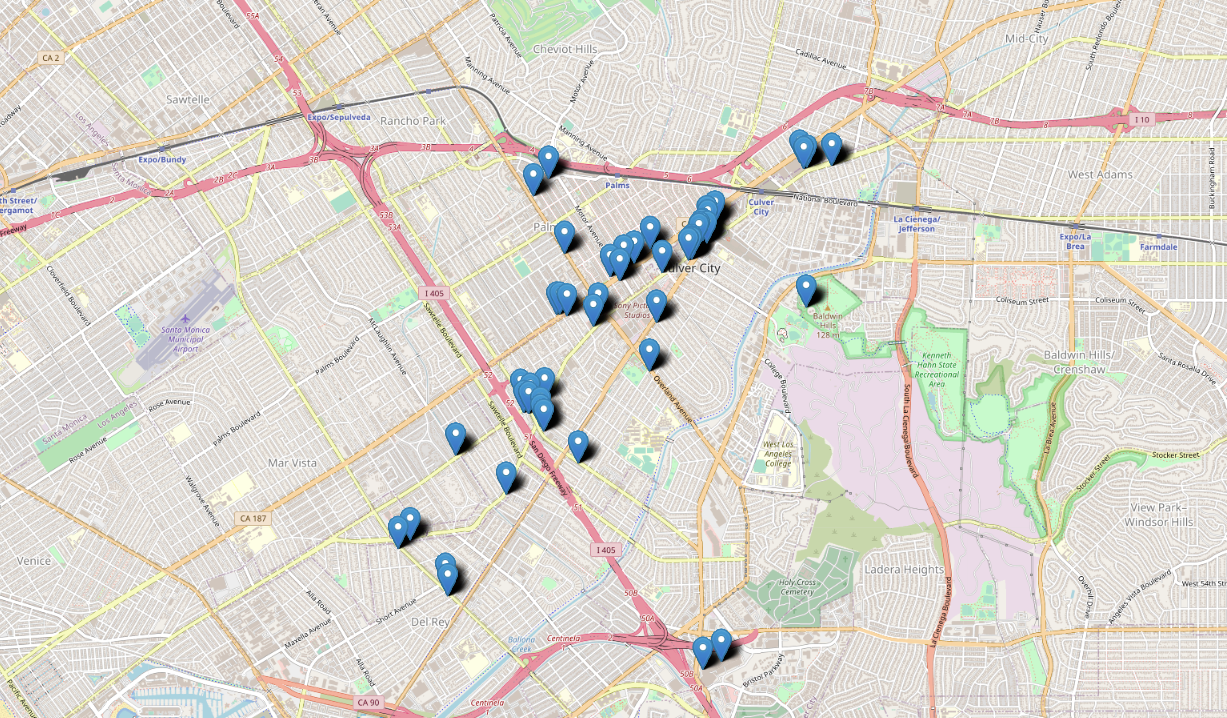
Fortunately, I did a sanity check on my data to make sure I really did capture Culver City, CA and legit businesses. An easy way to do so is by getting all the Culver City zip codes online and counting the number of businesses with zip codes outside of that list. There were a few stragglers that obviously didn’t belong, so I eliminated them. As a final check, I used folium in python to plot all the businesses on a map.
Design Process
Jumping into my first D3.js (self-taught) project was definitely challenging because unlike most other tools I have used, I felt limited by my ability rather than by the tool itself. Most of my experience has been plugging in data as a single parameter and tweaking the color and font of a pre-made chart. With D3, I felt like I was constructing every aspect of the chart using code, which had a really high learning curve.
I had been making dashboards for over 2 combined years at Sweetgreen and ZS, so I had a lot of trouble getting out of the “dashboard” mindset of laying out multiple charts in one page. I ended up organizing my visual like what I’ve seen in journalism to escape the dashboard layout.
Network Graph
The first chart I made was a network graph that shared the number of businesses in each category (nodes) and the number of businesses that shared multiple categories. One example of a business having multiple categories would be an Italian and Pizza restaurant.
I used D3’s force simulation to center the graph and draw the links. A problem I noticed with the simulation was that my dataset had so many nodes that spawned at the center that the first few seconds of the simulation had a very awkward collisions and jitter. One way to make movement smoother was to replace the default iterations value of 1 with a higher number (like 20). This allowed my script to calculation 20 steps before returning the nodes' next placements without noticeably compromising performance.
I also implemented dragging, hovering, and showing a tooltip. In a “mouseover” event, I would use d3.select(this) syntax to select the particular DOM element, manipulate it, and get its data. However, I found out that ES6’s arrow functions do not work on D3’s d3.select(this). The reason was that arrow functions (() => {} instead of function() {}) is lexically bound, meaning that this was bound to the scope in which it was defined (usually the window or the Class) instead of the particular DOM element. Therefore, whenever I wanted to use d3.select(this), I would use the non-arrow function function() { d3.select(this)... }.
Distribution Graph
The second chart I made was a histogram. It should look familiar because I took the idea from my Yelp profile (if you review on Yelp, they would show a distribution of your ratings in all your Yelp reviews). Since I got started using version 4 of D3 (until someone pointed out that v6 was available), I used D3’s nest and rollup method. These methods were deprecated in d3.v6.js, so I learned how to aggregate data using native methods like Array.reduce and Object.keys(object).map(). This code block below shows how I accomplished my first data aggregation in javascript, similar to how I regularly did LEFT JOINs in SQL.
let spine = {};
for(var i = 1.0; i <= 5.0; i = i+0.5) {
    spine[i] = [];
};

// grouped (Object) = {1.0: [], 1.5: []...}
let grouped = filteredData.reduce((p, c) => {
    // p[c["key"]] = (p[c["key"]]||[])
    p[c["rating"]].push(c["rating"]);
    return p;
}, spine);

// aggregate (Array) = [{key: 1.0, value: 4}, {key: 1.5, value: 4}]
this.aggregate = Object.keys(grouped).map(key => {
    return {
        key: key,
        // value: grouped[key].reduce((p, c) => p + c, 0) / grouped[key].length // get average
        value: grouped[key].length, // get count
    }
});